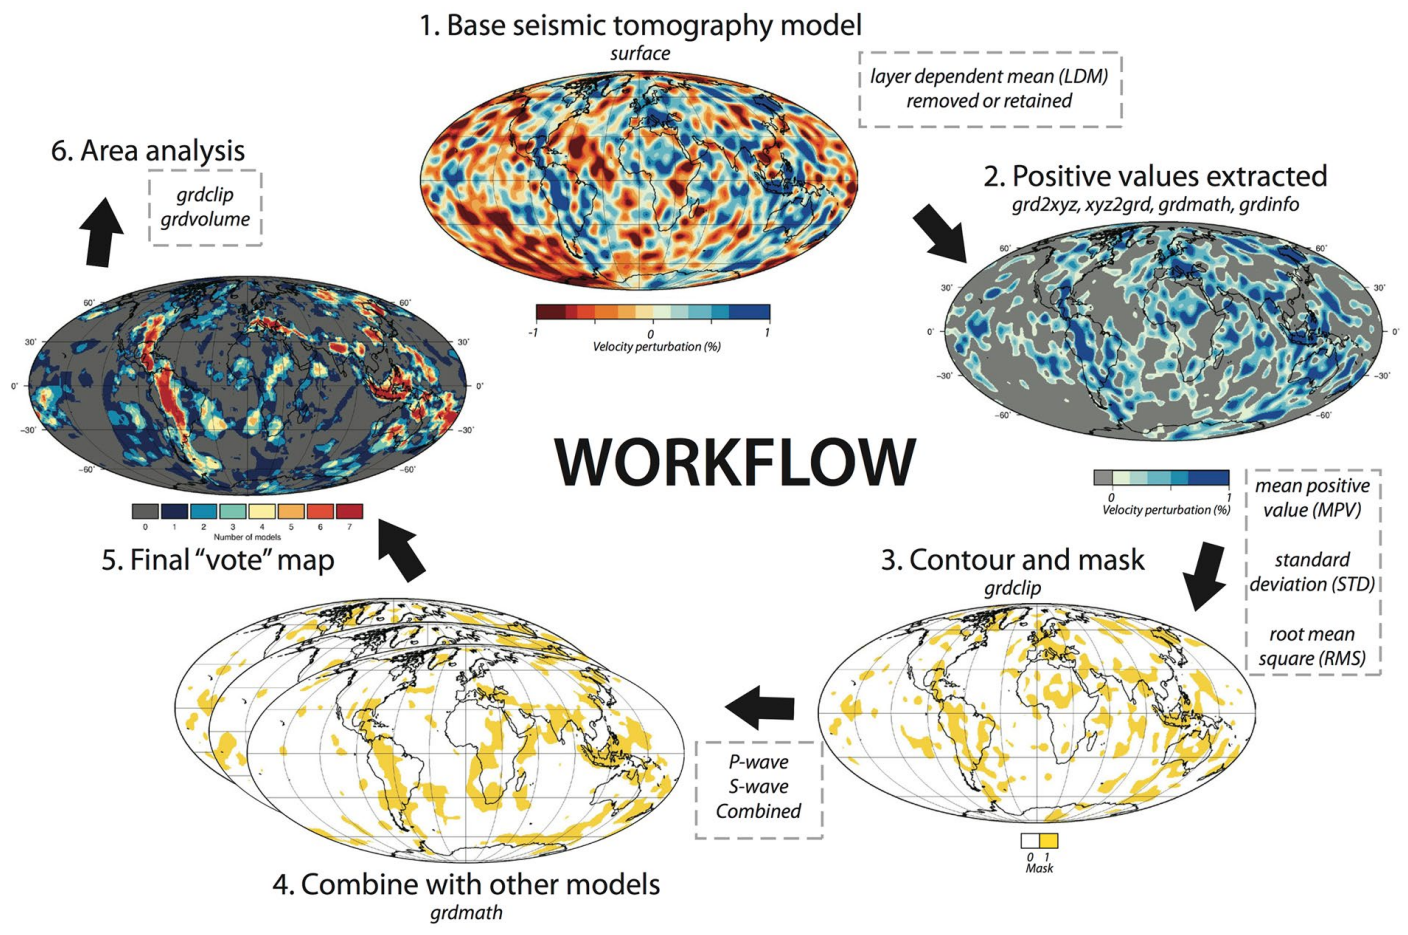
Seismic tomography reveals fast anomalies in the mantle interpreted as ancient subducted slabs, but different tomographic models often disagree on where slabs exist. How do we know which features are real? This study addresses the question by creating vote maps across 14 global tomography models, identifying which anomalies appear consistently. The workflow shows our methodology: apply depth-dependent thresholds to each model (identifying on average 20% of any depth as potential slab), then count votes to find the most robust features. A striking pattern emerges with depth: agreement peaks between 1000-1400 km, declines to a minimum around 2000 km, then increases again below 2500 km. This trend could reflect reduced tomographic resolution in the mid-mantle, or alternatively real changes in time-dependent subduction flux or a mid-lower mantle viscosity increase. The vote maps reveal how conclusions can vary dramatically depending on which models you trust.
Abstract
The geoscience community is increasingly utilizing seismic tomography to interpret mantle heterogeneity and its links to past tectonic and geodynamic processes. To assess the robustness and distribution of positive seismic anomalies, inferred as subducted slabs, we create a set of vote maps for the lower mantle with 14 global P-wave or S-wave tomography models. Based on a depth-dependent threshold metric, an average of 20% of any given tomography model depth is identified as a potential slab. However, upon combining the 14 models, the most consistent positive wavespeed features are identified by an increasing vote count. An overall peak in the most robust anomalies is found between 1000–1400 km depth, followed by a decline to a minimum around 2000 km. While this trend could reflect reduced tomographic resolution in the middle mantle, we show that it may alternatively relate to real changes in the time-dependent subduction flux and/or a mid-lower mantle viscosity increase. An apparent secondary peak in agreement below 2500 km depth may reflect the degree-two lower mantle slow seismic structures. Vote maps illustrate the potential shortcomings of using a limited number or type of tomography models and slab threshold criteria.
Keywords: seismic tomography, lower mantle, subducted slabs, vote maps, mantle structure, geodynamics
Citation
Please cite this work as:
G. E. Shephard, K. J. Matthews, Kasra Hosseini, M. Domeier. "On the consistency of seismically imaged lower mantle slabs". Scientific Reports (2017). https://doi.org/10.1038/s41598-017-11039-w
Or use the BibTeX citation:
@article{Shephard2017,
author = {Shephard, G. E. and Matthews, K. J. and Hosseini, K. and Domeier, M.},
title = {On the consistency of seismically imaged lower mantle slabs},
journal = {Scientific Reports},
volume = {7},
number = {1},
pages = {10976},
year = {2017},
month = {09},
day = {08},
abstract = {The geoscience community is increasingly utilizing seismic tomography to interpret mantle heterogeneity and its links to past tectonic and geodynamic processes. To assess the robustness and distribution of positive seismic anomalies, inferred as subducted slabs, we create a set of vote maps for the lower mantle with 14 global P-wave or S-wave tomography models. Based on a depth-dependent threshold metric, an average of 20% of any given tomography model depth is identified as a potential slab. However, upon combining the 14 models, the most consistent positive wavespeed features are identified by an increasing vote count. An overall peak in the most robust anomalies is found between 1000–1400 km depth, followed by a decline to a minimum around 2000 km. While this trend could reflect reduced tomographic resolution in the middle mantle, we show that it may alternatively relate to real changes in the time-dependent subduction flux and/or a mid-lower mantle viscosity increase. An apparent secondary peak in agreement below 2500 km depth may reflect the degree-two lower mantle slow seismic structures. Vote maps illustrate the potential shortcomings of using a limited number or type of tomography models and slab threshold criteria.},
issn = {2045-2322},
doi = {10.1038/s41598-017-11039-w},
url = {https://doi.org/10.1038/s41598-017-11039-w}
}